

Data is currently at
https://data.giss.nasa.gov/gistemp/tabledata_v4/GLB.Ts+dSST.csv
or
https://data.giss.nasa.gov/gistemp/tabledata_v4/GLB.Ts+dSST.txt
(or such updated location for this Gistemp v4 LOTI data)
January 2024 might show as 124 in hundredths of a degree C, this is +1.24C above the 1951-1980 base period. If it shows as 1.22 then it is in degrees i.e. 1.22C. Same logic/interpretation as this will be applied.
If the version or base period changes then I will consult with traders over what is best way for any such change to have least effect on betting positions or consider N/A if it is unclear what the sensible least effect resolution should be.
Numbers expected to be displayed to hundredth of a degree. The extra digit used here is to ensure understanding that +1.20C resolves to an exceed 1.195C option.
Resolves per first update seen by me or posted as long, as there is no reason to think data shown is in error. If there is reason to think there may be an error then resolution will be delayed at least 24 hours. Minor later update should not cause a need to re-resolve.
 1,000
1,000 3.00
3.00ERSSTv5 came out an hour or two ago. GHCNM is from last night, should be another in a few hours, but I won't be able to do another run until tomorrow. Expect below number to change quite a bit by the time the GHCNM data for the run they will use becomes available. April 10 is the scheduled GISTEMP release date (1 week from now).
From my gistemp run (gistemp mod with own ERSST->SBBX calculations)
ghcnm.v4.0.1.20250402:
135.168
@parhizj Thanks for sharing, for polymarket it is interesting to see whether it will exceed 1.365. Not impossible at all if you look at the deviations that happened in the past months
@Weatherman Can only guess which run they will use so who knows.
It would be better if they had some method about which ghcnm run they use but it seems they choose randomly as far as I know.
@parhizj My theory is that if the reporting of the final numbers is not on a Monday, it is based on the run one or two days prior.
@parhizj is the actual big uncertainty not what kind of upward or downward surprise we will see, is there any way to tell do you think?
@Weatherman There was large uncertainty then when I posted the question IMO.
We already have the ERA5 data now for the whole month, so that is a bit moot (it was likely closer to somewhere in between the two forecasts).
The remaining uncertainty at this point (at least until this month's ERSSTv5 data is released) is how you map ERA5 (or other reanalysis data) to GISTEMP's dataset. This uncertainty does seem to vary month by month (as you would expect), and depends on a number of factors. As I mentioned below this is somewhere in the range of +- 0.4 to 1.0 C depending on how you truncate the data. If you go just by my own last few predictions (7) using this model (which the stddev does vary by month) the std. dev. of the predictions themselves is between ~ 0.01 and 0.04. This leads me to think +- 0.04 C (95% CI) is a fairly aggressive uncertainty actually for this simple model that I use.
@gonnarekt Thanks for sharing your prediction, as so few do.
Point wise I’ve be getting between 1.32 to 1.33, but I have a much more conservative prob. dist. now for my models than most others I’ve seen posted.
@gonnarekt this is my prediction as well when comparing the era5 month to month. However, my gut feeling says that it is more likely to see deviations to lower temperstures
Month has ended ....
Still a couple days left of ERA5 data but the GEFS ARIMAX adjusted errors have been fairly low so it doesn't look like my point prediction will change much more than maybe 0.01 degrees:
Right now March looks its going to be ~ 1.341 +- 0.055 C
(this rough 95% CI estimate is just from the past few predictions, but doesn't include a prediction for a month like March. It's a bit different from my past few predictions which relied on the RMSE from the validation set of a linear model's RMSE to correct biases from ERA5->GISTEMP -- which could also be a by month model if it validates, or an entire year model if it also validates. If I try to narrow the CI using an alternate method by narrowing the sample set from March using later cutoff dates for the data (instead of 1940 which earlier decades have larger uncertainty) the RMSE only gets down to about 0.04 -- this is still larger than the ~0.027 std. dev. above).
I'll have a final point prediction from this model when ERA5 data is final in 2-3 days.
Edit:
For reference 1.34 falls right in the middle of the majority polymarket bin which has it at 78%

Manifold market is a bit unluckier and it's possible it might be a near coin toss in the next ~ 10 days as to which run ends up being chosen if GISTEMP runs hover between 1.34 and 1.35.
Final number for ERA5 will come tomorrow but the preliminary is good enough for a retrospective analysis on how averaging ARIMAX-adjusted GEFS-BC and ECM models worked out for the end of the month (tl;dr: pretty good); as such forecast hasn't changed much from above (1.338 C).
(GEFS-BC arimax is just 'gefs' below, and the 'splitted_offsetted' takes the mean for the remainder of the month at the time for both models and splits the difference to add a constant value to the gefs-bc arimax forecast):
I only started collecting the relevant performance metrics around the 27th (so about 6 days ago) but was fortunate enough that neither the arimax adjusted ECM, GEFS-BC were correct (as they showed a strong inflection point around then opposite directions a day earlier), and rather the real trend was as expected a middling in between the two (the question I asked related to this also had forecasters split roughly on this with it mostly a middling result per the spirit of the question)..
By lead time for all runs (this is the temperature over the available window of data for the remainder of the month):
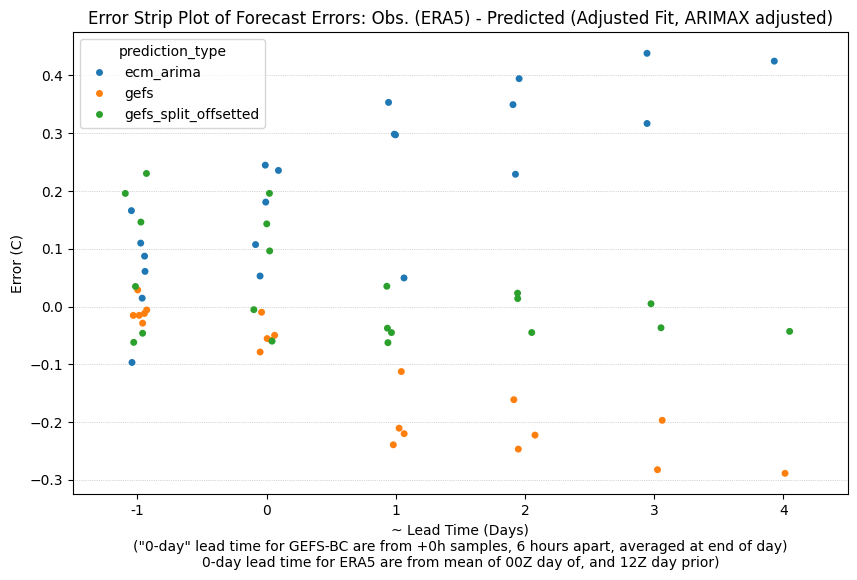
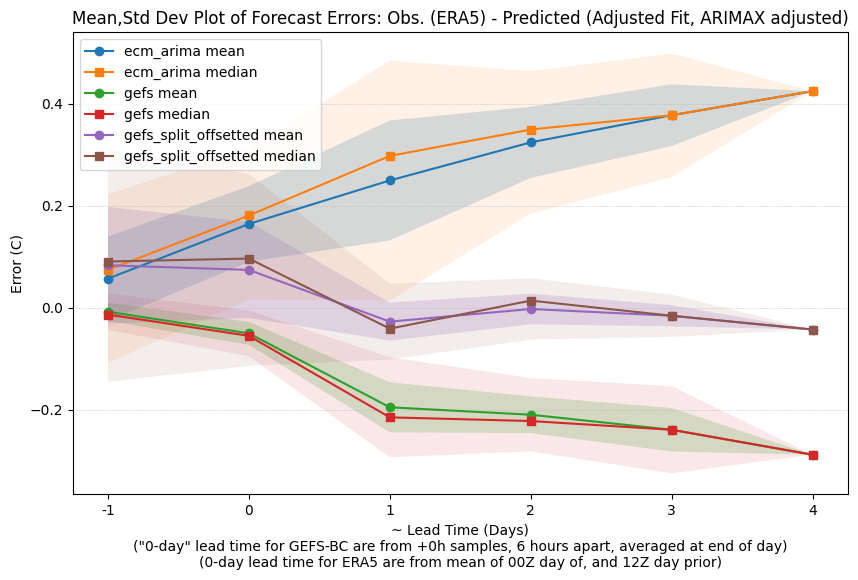
the 0 day lead time and -1 day lead time are the same base forecasts but adjusted with different ARIMAX adjustments based on updated ERA5 data. the 0 day and -1 day lead time for GEFS is different from ECM as for GEFS I sample from tau=0 at the 00, 06, 12, 18Z model runs whereas for ECM I just lazily take the average of the 12Z from the day prior and 00Z from the day of to get the temps for the 0 day.
For further out for the base GEFS-BC forecast I use is an adaptive mean depending on whether recent forecasts are significantly different from all the previous runs for each valid day. For the base ECM forecast I'm lazier and just use up to the last available 5 runs (00Z,12Z hours).
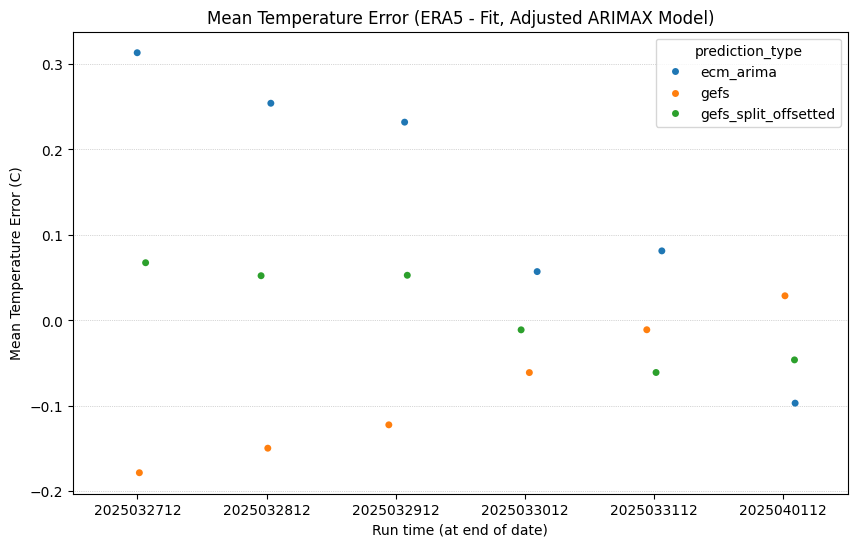
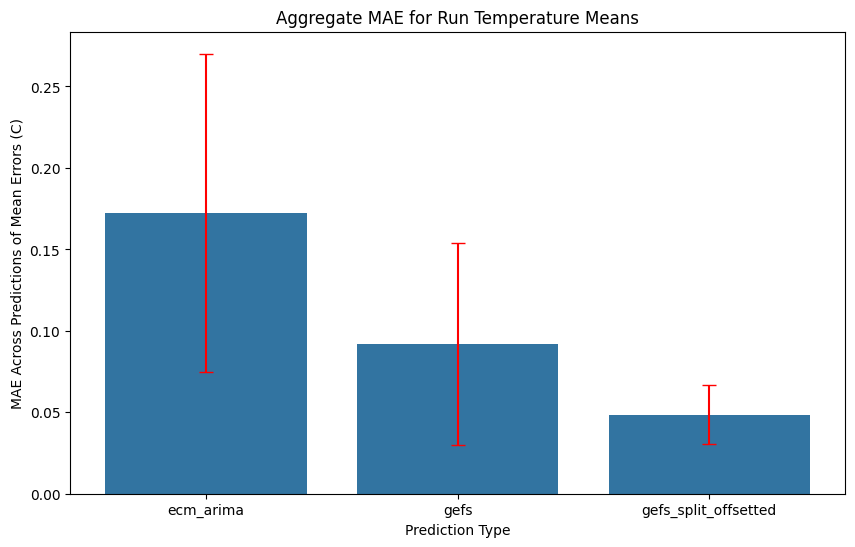
Splitting the difference had the lowest MAE aggregating each run for this small sample set.
Will see if this continues to work out...
GEFS and ECM now trending in opposite directions for end of month...
last ECM run unadjusted:
ECM_2025032012:
valid_date 2t
0 2025-03-21 14.597478
1 2025-03-22 14.533439
2 2025-03-23 14.457115
3 2025-03-24 14.422914
4 2025-03-25 14.437479
5 2025-03-26 14.417067
6 2025-03-27 14.338064
7 2025-03-28 14.271404
8 2025-03-29 14.226858
9 2025-03-30 14.241461
10 2025-03-31 14.257847
11 2025-04-01 14.266293
12 2025-04-02 14.326877
13 2025-04-03 14.407927
GEFS-BC runs from today unadjusted:
-- Processing ./gefs.20250320_00
--   Processing 105 files...
Global 2m temp average (C) for 03-20-2025: 13.820 (day over day delta:  0.000)
Global 2m temp average (C) for 03-21-2025: 13.749 (day over day delta: -0.070)
Global 2m temp average (C) for 03-22-2025: 13.726 (day over day delta: -0.023)
Global 2m temp average (C) for 03-23-2025: 13.745 (day over day delta:  0.019)
Global 2m temp average (C) for 03-24-2025: 13.841 (day over day delta:  0.096)
Global 2m temp average (C) for 03-25-2025: 13.904 (day over day delta:  0.062)
Global 2m temp average (C) for 03-26-2025: 13.930 (day over day delta:  0.026)
Global 2m temp average (C) for 03-27-2025: 13.936 (day over day delta:  0.006)
Global 2m temp average (C) for 03-28-2025: 14.000 (day over day delta:  0.065)
Global 2m temp average (C) for 03-29-2025: 14.122 (day over day delta:  0.122)
Global 2m temp average (C) for 03-30-2025: 14.191 (day over day delta:  0.069)
Global 2m temp average (C) for 03-31-2025: 14.286 (day over day delta:  0.095)
Global 2m temp average (C) for 04-01-2025: 14.391 (day over day delta:  0.105)
Global 2m temp average (C) for 04-02-2025: 14.457 (day over day delta:  0.067)
Global 2m temp average (C) for 04-03-2025: 14.472 (day over day delta:  0.015)
Global 2m temp average (C) for 04-04-2025: 14.489 (day over day delta:  0.017)
-- Processing ./gefs.20250320_06
--   Processing 105 files...
Global 2m temp average (C) for 03-21-2025: 13.762 (day over day delta: -0.298)
Global 2m temp average (C) for 03-22-2025: 13.728 (day over day delta: -0.035)
Global 2m temp average (C) for 03-23-2025: 13.736 (day over day delta:  0.008)
Global 2m temp average (C) for 03-24-2025: 13.840 (day over day delta:  0.104)
Global 2m temp average (C) for 03-25-2025: 13.927 (day over day delta:  0.087)
Global 2m temp average (C) for 03-26-2025: 13.954 (day over day delta:  0.027)
Global 2m temp average (C) for 03-27-2025: 13.972 (day over day delta:  0.018)
Global 2m temp average (C) for 03-28-2025: 14.070 (day over day delta:  0.098)
Global 2m temp average (C) for 03-29-2025: 14.204 (day over day delta:  0.134)
Global 2m temp average (C) for 03-30-2025: 14.193 (day over day delta: -0.012)
Global 2m temp average (C) for 03-31-2025: 14.356 (day over day delta:  0.164)
Global 2m temp average (C) for 04-01-2025: 14.440 (day over day delta:  0.084)
Global 2m temp average (C) for 04-02-2025: 14.506 (day over day delta:  0.066)
Global 2m temp average (C) for 04-03-2025: 14.545 (day over day delta:  0.038)
Global 2m temp average (C) for 04-04-2025: 14.543 (day over day delta: -0.002)
-- Processing ./gefs.20250320_12
--   Processing 105 files...
Global 2m temp average (C) for 03-21-2025: 13.753 (day over day delta:  0.011)
Global 2m temp average (C) for 03-22-2025: 13.711 (day over day delta: -0.041)
Global 2m temp average (C) for 03-23-2025: 13.707 (day over day delta: -0.004)
Global 2m temp average (C) for 03-24-2025: 13.806 (day over day delta:  0.099)
Global 2m temp average (C) for 03-25-2025: 13.890 (day over day delta:  0.084)
Global 2m temp average (C) for 03-26-2025: 13.912 (day over day delta:  0.022)
Global 2m temp average (C) for 03-27-2025: 13.921 (day over day delta:  0.009)
Global 2m temp average (C) for 03-28-2025: 13.992 (day over day delta:  0.071)
Global 2m temp average (C) for 03-29-2025: 14.127 (day over day delta:  0.135)
Global 2m temp average (C) for 03-30-2025: 14.339 (day over day delta:  0.212)
Global 2m temp average (C) for 03-31-2025: 14.296 (day over day delta: -0.043)
Global 2m temp average (C) for 04-01-2025: 14.373 (day over day delta:  0.077)
Global 2m temp average (C) for 04-02-2025: 14.451 (day over day delta:  0.078)
Global 2m temp average (C) for 04-03-2025: 14.470 (day over day delta:  0.019)
Global 2m temp average (C) for 04-04-2025: 14.452 (day over day delta: -0.018)
-- Processing ./gefs.20250320_18
--   Processing 105 files...
Global 2m temp average (C) for 03-21-2025: 13.767 (day over day delta:  0.788)
Global 2m temp average (C) for 03-22-2025: 13.713 (day over day delta: -0.055)
Global 2m temp average (C) for 03-23-2025: 13.693 (day over day delta: -0.020)
Global 2m temp average (C) for 03-24-2025: 13.791 (day over day delta:  0.099)
Global 2m temp average (C) for 03-25-2025: 13.880 (day over day delta:  0.089)
Global 2m temp average (C) for 03-26-2025: 13.893 (day over day delta:  0.012)
Global 2m temp average (C) for 03-27-2025: 13.880 (day over day delta: -0.013)
Global 2m temp average (C) for 03-28-2025: 13.927 (day over day delta:  0.048)
Global 2m temp average (C) for 03-29-2025: 14.029 (day over day delta:  0.101)
Global 2m temp average (C) for 03-30-2025: 14.278 (day over day delta:  0.249)
Global 2m temp average (C) for 03-31-2025: 14.230 (day over day delta: -0.048)
Global 2m temp average (C) for 04-01-2025: 14.318 (day over day delta:  0.088)
Global 2m temp average (C) for 04-02-2025: 14.397 (day over day delta:  0.078)
Global 2m temp average (C) for 04-03-2025: 14.428 (day over day delta:  0.031)
Global 2m temp average (C) for 04-04-2025: 14.435 (day over day delta:  0.008)
Polymarket is very confident in the 1.32-1.36 bin...

I don't really have a clue what the final temperature will be so precisely, but the splitting the adjusted forecasts puts a point forecast at ~ 1.33 in my model which at least agrees with the general symmetry and most probable bin of Polymarket. I still have a much lower confidence though than Polymarket's current odds do.
The remainder of the month should be interesting: there has been a small dip so far in recent ERA5 data, and GEFS has slightly adjusted in last couple days but GEFS still indicates a trend upwards, opposite of ECM that wants to trend downwards.
I have adjusted methodology for the GEFS forecasts (using an adaptive averaging approach rather than averaging all past forecasts to generate the predicted day average for GEFS (weighting last couple days as the average (slight exp. decay more towards recent ones, but discarding the older forecasts) when all 8 forecasts vary significantly from the larger pool's forecast std. dev).
Also switched to ARIMAX rather than using OU after doing much more testing with the data; not much change indicated (ARIMAX is more conservative over OU at least for the remainder of the month: wanting to bring down GEFS temps by ~0.06 vs ~0.10 adjustment over last 8 days)
Despite all that, GEFS and and ECM are still far apart; even if you assume the average of the remaining ERA5 temps (Mar 24-31) will end up somewhere in between, the difference is then 0.59 / 2 ~= 0.3 C. (This might be a bit exaggerated if the ARIMAX adjustments both perform poorly in trying to adjust to the correct ERA5 temps).
The ECM dip looks too extreme but the GEFS rise only looks slightly less plausible after the recent dip)
(the GEFS (red line) and the ECM in the charts both have forecasts adjusted by ARIMAX)

EdiT: The latest ARIMAX adjusted forecasts to ERA5 using ECM, GEFS look much more smooth and plausible (continuous) intuitively to my human eyes with the latest ERA5 temps.
ECM still showing a dip on the 28th of ~ 0.1 to 0.15 degrees from the prior day, and the remainder of the days for the month are on the cool side relative to today. Still disagreement between the two about the trend for the remainder of the month. (GEFS_ARIMAX only shows the most minor of a dip around then)
(RED is ERA5 historical up until Mar. 24 then GEFS_ARIMAX followed by statistical long run extrapolation; BLUE are last 5 ECM_ARIMAX runs):


Latest 4/5 (adjusted) runs from ECM (last 2 days) show the rest of the month on average nearly plateauing ... consequently, splitting the difference requires downwardly adjusting the GEFS offset quite a bit further than I thought might happen two days ago...
@LeonardoParaiso As I said previously where before (last week) ECM and GEFS were in somewhat decent agreement on the trend of rising temps for the end of the month, now there is a bifurcation: recent ECM runs says there will be (roughly) a plataeu, while GEFS continues having a trend of rising temps (albeit from the current much lower temperature than I anticipated even a few days ago).
The sharp rise during the middle of the month that GEFS predicted a week ago hasn't happened though which doesn't bode well for GEFS....
I think the Manifold's current odds are more plausible though than Polymarket's high certainty, but I won't be surprised if there is more flip-flopping, so I still favor an even flatter distribution than what even Manifold has given the uncertainty....
@SiebeNijland Yeah, the trend as of yesterday for recent ECM runs is lower ... (GEFS adjusted reference - ERA5_ARIMA model runs)
   model_init  avg_diff
0  2025031612  0.171753
1  2025031700  0.183720
2  2025031712  0.252170
3  2025031800  0.277377
4  2025031812  0.334323